Face Recognition Using the NFL Method
The Nearest Feature Line (NFL) method

A feature line is the line passing through two prototype points,
x1 and x2. It generalizes the representational capacity of
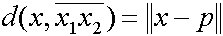
the two prototype images. In the NFL, the distance between the query
x and its projection p on to the feature line is used as
the distance metric
 The NFL-based classification is performed as follows: Let
  and
and  be two distinct prototype feature points belonging
to class c, and x be the query. The NFL distance is
be two distinct prototype feature points belonging
to class c, and x be the query. The NFL distance is
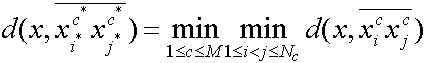 where M is the number of class,
  is the number of distance of class
c,
is the number of distance of class
c,  is the best
matched class,
is the best
matched class,  and
and  are the two
best matched prototypes of the class .
are the two
best matched prototypes of the class .
Experiment Results
Comparison with
the standard eigenface method
A compound data set of 1079
face images of 137 persons is used in this experiment. It is composed of
five databases:
-
The Cambridge (ORL) database(400)
-
The Bern database(300)
-
The Yale database(150)
-
Harvard database(50)
-
Our own database (Chinese students)
(179)
Error rates are computed for two test schemes
-
535 images as the query set, others
for training. The error rate of the NFL is between 55.6% to 65.4% of that
of the standard method.
-
All the 1079 images as the query set.
The error rate of the NFL is between 43.7% to 48.3% of that of the standard
method.
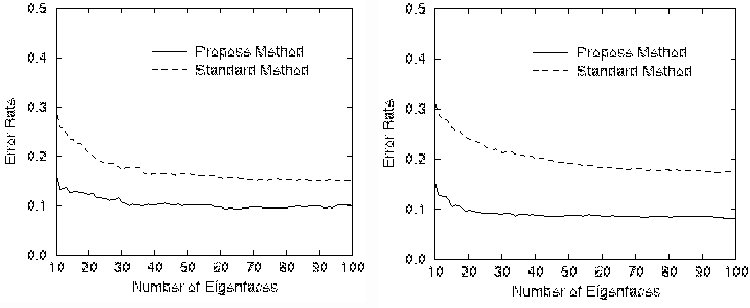
Comparison of error rates obtained with test scheme 1 (left)
and scheme 2
Comparison with the Convolutional Neural Network (CNN)
The ORL face database of Cambridge is used with 200 images for training,
the other 200 for testing. The error rates are the average results
obtained by 4 runs. The CNN error rate is 3.83%, reported previously as
yielding the lowest error rate for ORL. The NFL error rate is 3.125%,
lower than the CNN rate.
0. System Structure
1. Learning-based face detection
2. Face extraction using EigenSnakes
3. NFL-based face recognition